
By Lance Cody-Valdez – free-lance-now.com/
If you’re an entrepreneur or an owner of a new business, you likely face unique challenges every day. For example, you may be trying to decide how to market your new product, negotiate with an investor, or show clients exactly how your business can help them achieve their goals.
According to IBM, data visualization uses a set of powerful tools that can help you translate your vision into real-world terms such as charts and infographics. Learn more about how it can add value to your operation.
What Are Common Data Visualization Tools?
Have you ever pulled up an infographic of a medical condition to discover what symptoms affect which parts of the human body? Or, perhaps you didn’t understand how much money your company made last year until you plugged the values into a chart or spreadsheet. Consider these tools as you decide what’s right for your business.
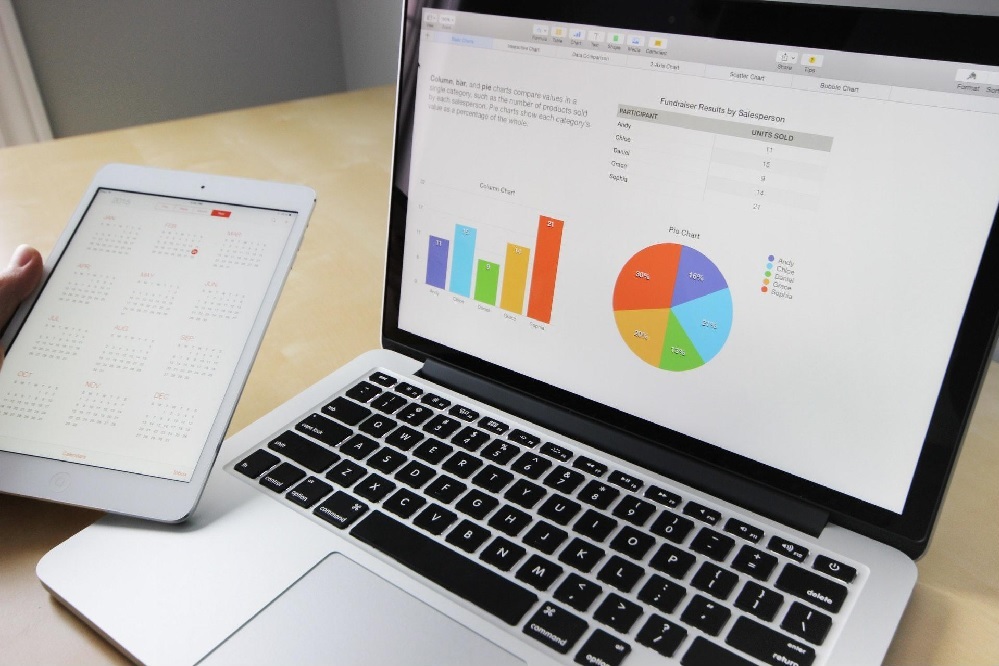
- Charts and graphs
- Infographics
- Animations
- Diagrams
What Value Does Data Visualization Add to Business?
Think of visualization as an investment if you’re planning on spending part of your budget on designing graphics or creating custom animations. You’ll likely see gains in the following areas:
1. Internal Operations
Though most people can process information well from many sources, some people feel lost when there is no visual representation of data, and others simply don’t like translating pages of numbers and data into real-world solutions. You may notice an uptick in your team’s creativity throughout the design process of a new infographic. When you start thinking about your business, products, and sales process in a visual way, you’ll see your whole operation from a different angle.
2. Marketing
Sometimes it’s not enough to tell your future clients what you can do for them. Pictures, infographics, and animations can convey the truth with more clarity and urgency than a sales pitch. When you’re creating data visualization models to show your clients, at the heart of your goal is communication. You’re trying to show potential customers why they should care about a problem or gap in services — and why you are perfectly positioned to fill a need for them.
3. Finances
For businesses, having feature-rich accounting software is essential to understanding their current financial state and predicting future needs. The data visualization feature of such software presents information in an easily digestible format, allowing users to see trends and projections at a glance. This is particularly useful for forecasting cash flow and making financial projections, as well as automating tasks that take up too much time (like payroll or tax filing). With integrated accounting software, businesses can make informed decisions about where to allocate their resources and how to plan for future growth.
4. Investors
Investors often care about contributing to specific causes as much as they want to multiply the dollars they’ve given you. Graphics and charts can help illustrate to your investors how your company’s product or services fill a societal need. Data visualization can also give investors the big-picture financials to aid them in understanding whether your company is up to the challenge — or, in other words, whether you are worth the investment.
Data visualization is a powerful way to show your client, investor, or future customers exactly what goods and services you provide. It can also clearly illustrate the gap between where customers are now and where they can go with your help. These graphs and charts don’t have to be high-tech, expensive, or extensively detailed. For example, if you plan on creating a flyer to hand out to customers, try this online flyer maker and customize the colors, fonts, and text boxes for your business’s campaign.
For those who learn visually, a clear infographic can be the difference between choosing one product or company over another. Don’t delay in using visual aids to help your business reach its full potential!

